The report
Write the interactive HTML report:
npx nestjs-doctor@latest . --reportWrites nestjs-doctor-report.html to the project root and opens it. One file,
no build step. Commit it or attach it to a pull request.
--output names a different path, which keeps the file out of the repository
being scanned.
Five things load from the network when opened. The graph layout library and the logo are one request each. The IBM Plex Mono font is a stylesheet plus the font files it names. The code viewer is a CodeMirror import map, so it pulls 18 modules from esm.sh. The fifth reports which tab was opened, carrying the nestjs-doctor version, the tab name, whether the file was generated in CI or from the CLI, and nothing read from the page.
Offline, the module graph falls back to a plain grid and the code viewers do not load. The text falls back to the system monospace font. Everything else works, including the schema diagram's layout.
What is in it
| Tab | Shows |
|---|---|
| Summary | The score, the category breakdown, and the counts behind them |
| Findings | Every finding with a code viewer and a fix example |
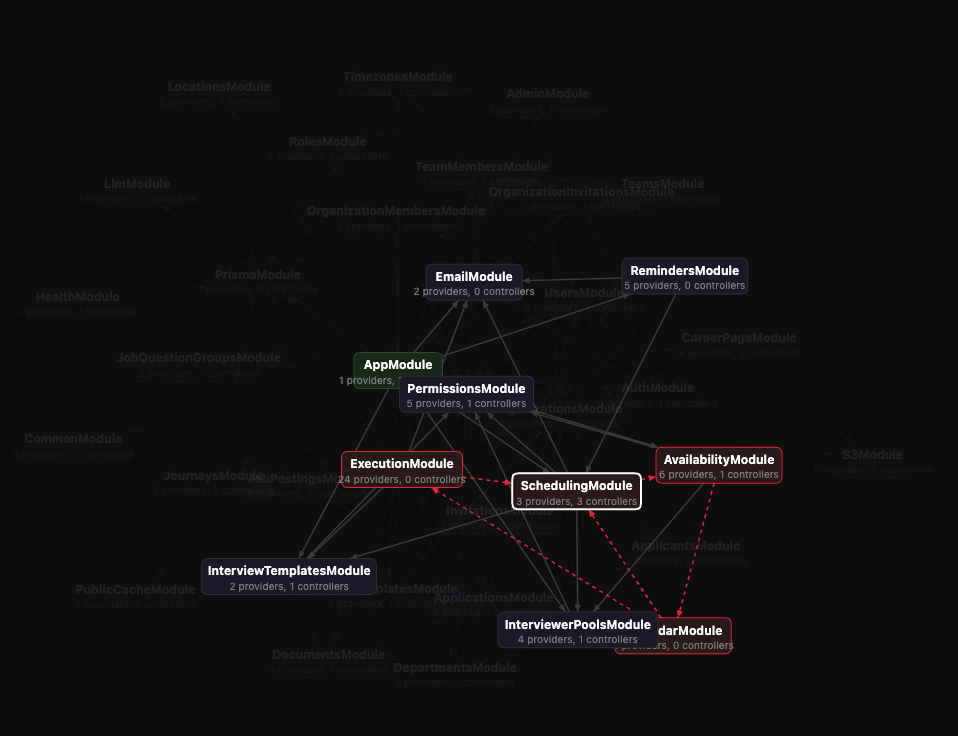
| Modules Graph | Your real module graph, clustered, with cycles in red |
| Endpoints | Every route walked in execution order, with what each one touches |
| Relational Schema | The ER diagram extracted from your ORM |
| Rule Lab | A playground for writing a custom rule against your own code |
Endpoints and Relational Schema stay hidden until there is data. A project with
no controllers and no ORM entities sees four tabs. The Endpoints tab is badged
Beta.
Endpoints also needs the code graph, and not every run builds one:
| Run | Builds the code graph |
|---|---|
--report | Yes |
--format report-json | Yes |
| A console run that ends in the post-scan menu | Yes |
| Anything else, CI included | No |
A report file written before the code graph shipped has no Endpoints tab when you open it at nestjs.doctor/report.
A share button in the nav picks sections of the report and downloads them
as JSON. The scan precomputes every slice, so the page only merges what you
tick and adds the code graph with its paths made relative. The file opens in the browser at nestjs.doctor/report, and
so does the full --format report-json artifact. See
Sharing a report.
Module graph covers reading that tab: cycles, blast radius, and the toggles.
Findings that do not score
A rule can report without moving the score. Summary shows how many under the
number, as 70 of 407 not scored, so the two reconcile. Findings hides those
findings behind a Show not scored checkbox above the severity filters, and
badges each one not scored beside its rule id when you turn it on.
Which rules those are is up to the rule and your config. See Surfaces.
Endpoints
The tab takes one route and walks the code under it.
The sidebar groups routes by controller, the same tree the other tabs use. A one-line verdict about database calls sits under each route. Pick a route to load its walk.
The map lays every method the route reaches into a column by call depth. One card is one method. One wire is one call site, so a method called twice from the same body draws two wires.
Color says what the callee does: read, write, throw, external, or gray for the rest. Every wire draws dashed, and a conditional call site uses a longer dash than a plain one. A doubled wire marks a concurrent call site.
A call back to an equal or shallower depth draws a short dash and routes through the lanes under the last row, so no wire crosses a card.
Next and Play step the walk. Each step lights its card and drops a block on the pile at the right. The pile is the route's history up to the step you are on, so Prev and Reset shrink it again.
The walk is source order of call sites, depth first from the handler. It is not a runtime trace. The walk emits a callee already on the current path as a step and stops there, so recursion shows once instead of looping.
The database verdict
The verdict names the first database read and the first database write on the
path, and which ran first. Only nodes the scan classified as db count, and
direction comes from the ORM method name:
| Method name starts with | Direction |
|---|---|
find, get, count, aggregate | read |
create, update, upsert, delete | write |
| anything else | other, counted as neither |
The line takes one of six forms:
| Verdict | Means |
|---|---|
read before write · @2 then @5 | Both directions ran, the read first |
write before read · @2 then @5 | Both directions ran, the write first |
read @2, no write | Reads only |
write @2, no read | Writes only |
db calls, direction unclassified | Every db node on the path fell into other |
no db node on this path | The walk reached no db node at all |
no db node on this path is not a claim that the route touches no database. A
driver the scan did not classify as db is invisible to this line, so read it
as what the graph can see.
Filters
The preset row narrows which steps play and which land on the pile. Hiding steps never reorders the ones that stay:
| Preset | Keeps |
|---|---|
| all | every step |
| effects | write, read, throw and external |
| problems | throws, warns, errors, and guarded call sites |
| no logs | everything except log, warn and error |
| database | only the steps that land on a db node |
Each route opens on the preset that fits its walk. A walk under seven steps
opens on all. A longer one opens on database, unless it reaches no db
node, which opens on all too.
The preset row prints which one is in force and the counts it used.
The ⋯ button opens eight more chips, one per step category, each with its own
count. Two more chips follow, guard and db. Those two are overlays: they add
the steps they name on top of whatever the categories keep, rather than
narrowing the set further.
Every step carries the marks of its own call site:
| Mark | Means |
|---|---|
rec | the callee is already on the current path, so the walk emits it and stops |
again | the walk reached this node earlier, and this call site is not recursive |
not awaited | the call site has no await |
cond | the call site sits inside a branch |
try | the call site sits inside a try block |
guard | a null-check throw guards the call, so later steps may not run |
‖ | a Promise.all collects the promise |
loop | the call site sits inside a loop |
cb | the call site sits inside a callback |
Read not awaited narrowly. It covers return svc.foo(), a fire-and-forget
call, and a promise collected by Promise.all. The graph cannot tell those
apart, so the mark never claims the call was forgotten.
Boot trace
The graph can overlay how long every provider and controller took to construct during one real boot. Lifecycle hook durations come along with them.
Producing those numbers needs one change to main.ts, because a scan never
runs your application. Boot trace covers the change
and how to read the result.