Module graph
The report draws your module graph from the @Module() decorators in your
source.
Scan a project and open the report:
npx nestjs-doctor@latest . --reportThe graph is one tab inside that report, and there is no separate graph file. See The report for where the file lands and what else is in it.
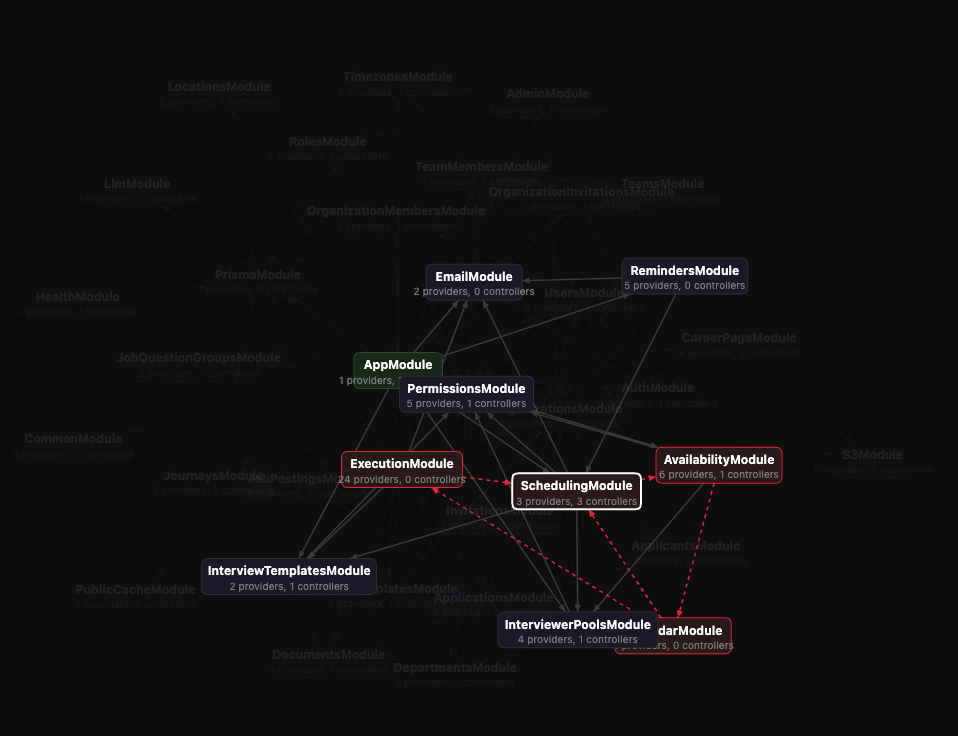
Reading the canvas
Node color carries the state of a module, and nothing else:
| Color | Meaning |
|---|---|
| Green | A root module: nothing imports it, or NestFactory boots it |
| Yellow | Marked @Global(), with a halo around the node |
| Red | Part of a circular import chain |
| Gray, dashed | An external module from a package, hidden by default |
Red wins over yellow. A @Global() module inside a cycle renders as a cycle.
Drag or scroll to pan, pinch or hold ctrl to zoom. The sidebar searches modules and projects at once, filtering the tree and the canvas together.
Cycles
Modules in a cycle turn red, and the edges between them animate as red dashes.
A Circular dependencies section lists each chain as UsersModule → OrdersModule → UsersModule. Clicking a chain zooms to it and drops everything
else to 15% opacity. A cycle buried in 200 modules becomes the only thing on
screen.
Each entry carries the fix guidance from
no-circular-module-deps.
forwardRef() does not hide a cycle. The import resolves, the edge is drawn,
and the chain still reports.
Picking a module
Selecting a node dims everything except its neighbors. Imports draw blue and importers draw green. Both use moving dashes, so direction reads at a glance.
The detail panel then covers seven things, in order: used by, blast radius, providers, imports, exports, wiring, and circular dependencies.
Blast radius answers what breaks if you change this module. It walks the
import graph backwards and counts every module that reaches the selected one,
splitting them into direct importers and indirect ones. Each indirect module
shows the chain that connects it, as via AuthModule → UsersModule.
That number is import reachability, not runtime traffic. A module with a blast radius of 40 is imported by 40 modules. It says nothing about how often the code runs.
Wiring
The wiring section walks from a module's controllers to its routes, then into
the providers each handler calls. A route reads GET /users · findAll, and
expands into the collaborators that handler injects.
When tracing finds nothing, the panel says so instead of showing an empty tree.
A custom decorator that composes @Controller() can hide handlers from the
scanner, and the note names that case.
Module problems
A dock at the bottom of the canvas lists findings from rules tagged
module-graph, custom rules included. Clicking one flies to the module that
owns it. Code-level findings stay on the Findings tab, so this dock holds
wiring findings only.
Toggles
Two toggles sit above the canvas, and both start off:
- Show
@Global()reach: draws a dotted yellow line from every@Global()module to every module that does not already import it. A global is available in every module without an import, whether or not that module injects anything from it. - Show external modules: adds package modules like
ConfigModuleas gray dashed nodes in their own cluster. They are never edges in the underlying graph, so they only appear here.
Leave @Global() reach off on a large project. It draws one line per global per
module, and the cost grows with both.
Monorepos
A monorepo produces one merged graph covering every sub-project. Each sub-project becomes a labeled cluster with its own color and module count.
Cross-project imports draw in cyan dashes at reduced opacity, so they read as secondary to the edges inside a sub-project. Blast radius counts projects alongside modules, and anything crossing a sub-project boundary carries a project badge.
One case produces no edge. A module imported by a bare name that is ambiguous across the workspace stays unresolved. The scanner will not guess which sub-project meant it.
Boot times on the graph
--timings overlays how long each class took to construct during one real boot.
Node subtitles gain the slowest class's build time and the module's hook
time. A package node keeps its package line and shows its time in the
tooltip. A Boot trace tab appears, with a compact mount in the bottom dock.
That needs one change to main.ts, because a scan never runs your application.
Boot trace covers the change and how to read the
result.
Limits
The graph is built from source text alone, and types are never resolved. Four consequences follow:
- Same-named modules union. Two
@Module()classes namedSharedModulein different directories become one node with the metadata of both, and the scan warns. Monorepos are exempt, because module names are prefixed per project. importsinside aDynamicModuleliteral add no edge. A factory's returned literal yields one edge, to the module itsmodulekey names.forwardRef()imports look like plain imports. The edge is correct, but the drawing does not mark which side used it.- Offline the layout degrades. See The report.
--report also ignores the flags that narrow or gate a scan. --scope,
--base, --staged, --min-score, and --blocking have no effect on it, and
a report always exits 0. Run a gating scan as a separate command, which
Failing the build covers.
There is no PNG, SVG, or DOT output, no alternative layout, and no comparison against a previous run.