 nestjs-doctor
Output
Source: src/cli/formatters/console-reporter.ts, src/cli/formatters/json-reporter.ts
What
Renders the final scan results in the requested format.
Why
Different use cases need different formats. Humans want the visual console report. CI pipelines want --score or --json. Tooling integrations want structured JSON they can parse.
Input
interface DiagnoseResult {
  score: Score
  diagnostics: Diagnostic[]
  project: ProjectInfo
  summary: DiagnoseSummary
  ruleErrors: RuleErrorInfo[]
  schema?: SerializedSchemaGraph
  elapsedMs: number
}

interface DiagnoseSummary {
  total: number
  errors: number
  warnings: number
  info: number
  byCategory: Record<Category, number>
}
Output Formats
Console Report (default)
The visual report includes:
- ASCII art NestJS bird (happy, neutral, or sad based on score)
- Score display:
82 / 100 ★★★★☆ Good - Score bar visualization
- Summary: error/warning/info counts, file count, elapsed time
- Project info: name, NestJS version, ORM, module count
- Diagnostics grouped by rule, sorted by severity
- With
--verbose: file paths and line numbers per diagnostic
Color coding:
- Green: score >= 75
- Yellow: score >= 50
- Red: score < 50
JSON (--json)
Full DiagnoseResult as pretty-printed JSON to stdout:
npx nestjs-doctor . --json
Useful for piping into other tools:
npx nestjs-doctor . --json | jq '.diagnostics[] | select(.severity == "error")'
Score Only (--score)
Just the numeric score:
npx nestjs-doctor . --score
# Output: 82
Useful for CI scripts that need to capture the score:
SCORE=$(npx nestjs-doctor . --score)
Monorepo Report
In monorepo mode, the console report shows:
- Combined score and diagnostics (same as single project)
- Per-project breakdown table:
  Project     Score    Files   Errors  Warnings  Info
  api         85/100   42      1       3         0
  admin       78/100   31      2       2         1
  shared      95/100   18      0       1         0
HTML Report (--report)
Generates a self-contained HTML file with an interactive report:
npx nestjs-doctor . --report
The report includes five tabs:
- Summary — health score overview with category breakdown
- Diagnosis — source-level findings with code viewer and fix examples
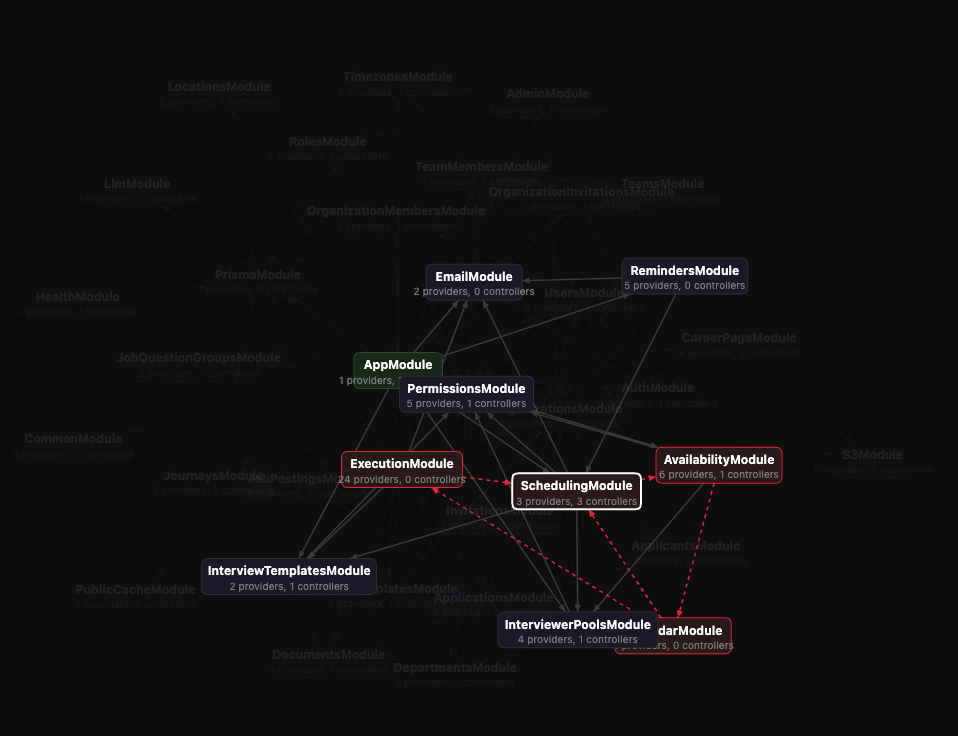
- Modules Graph — directed graph layout with draggable nodes, directed edges, color coding, detail panel with auto-focus, and circular dependency recommendations
- Schema ER Diagram — entity-relationship visualization of database models
- Lab — custom rule playground to write and test your own rules
Output: nestjs-doctor-report.html in the project root, auto-opened in the default browser.
Exit Codes
| Code | Meaning |
|---|---|
0 | Score is at or above threshold (or no threshold set) |
1 | Score is below --min-score threshold, or errors were found |
2 | Invalid input (bad path, invalid flags) |
All output formats respect exit codes. The --min-score check happens after output, so you always see the report even when the exit code is 1.